Lab 6 - Data Visualization
- 📝 Worth: 2%
- 📅 Due: Friday April 26, 2024 @End of class
- 🕑 Late submissions: 3 days maximum, 10% late penalty
- 📥 Submission: In class @end of class.
Objectives
The next requirement of this app is to implement the dashboard page to include a summary of the data and allow the user to view graphs.
Data Visualization
Data Visualization is the representation of data using graphics such as charts, plots, animation, etc. It is a great way to increase the added value of your app to the user. You might be planning to add charts or other visualizations in your app.
How to choose the appropriate visual?
What are you representing?
- Numeric: temperature and humidity readings, calories, etc.
- Categorical: ON/OFF, True/False, Car Models, Brands, etc..
Why are you representing this data?
- The user needs to monitor temperature to make sure it isn’t above the threshold
How to present this information?
Examples:
- If you are interesting in monitoring a trend: user line charts
- If you are interesting in comparing two numbers or more, use bar charts or pie charts
- If you are interesting in comparing numbers in 2D or 3D: use maps or heatmaps.
- If you are trying to represent many different attributes on the same chart, you can use the size, tilt and color of the markers as way to convey information.
Dos and Dont’s
- Keep it simple: We can create a tone of very cool visualizations but this can be overwhelming. Many people don’t have a strong ability to decode visual elements which can just look very complex and hard to understand.
- Avoid using too many colors: Remember that a significant portion of people are color blind and they can’t distinguish certain colors!
- Avoid redundancy: Don’t encode the same information twice!
- Try to group information as much as you can to avoid cluttering.
Setup
-
Accept and clone the Lab:
-
Right-click on the solution and choose
Manage Nuget Packages -
Go to
Browsetab -
Make sure to check
Include Prerelease -
Search for
LiveChartsCore.SkiaSharpView.Maui -
Correction 04-26-2024: Install version
2.0.0-beta.rc2 (Latest)- This is a free package and tested to be working with
MUIand.NET 7.0 - Has a clear documentation with code examples in
C#andxaml. - Make sure to consult the LiveCharts2 documentation to avoid confusion.
- Main issues:
- there is no direct link between a collection of objects and chart data. This package uses custom classes called Series to populate the charts with data. You’ll have to convert the data you want displayed into those special objects.
- Every graph element such as custom x and y axes and titles need to be created in C#, so you have to restart the app very often in this lab to test each step.
- This is a free package and tested to be working with
-
Since this package is not part of the
MauiCommunityToolkit, you have to add it to your app builder.In MauiProgram.cs:
var builder = MauiApp.CreateBuilder(); builder .UseMauiApp<App>() .UseSkiaSharp() // add this line .ConfigureFonts(fonts => { fonts.AddFont("OpenSans-Regular.ttf", "OpenSansRegular"); fonts.AddFont("OpenSans-Semibold.ttf", "OpenSansSemibold"); }); -
To help you sign in more quickly, modify the
LoginPage.xaml.csand hardcode the correct credentials in theuser_name.Textandpassword.Textwithin the constructor of the pageUsing
LiveChartspackage -
Go to
MeasuresPage.xaml -
Add the namespace for
LiveChartswithin theContentPageopening tag:xmlns:charts="clr-namespace:LiveChartsCore.SkiaSharpView.Maui;assembly=LiveChartsCore.SkiaSharpView.Maui" -
Add two
CartesianChart:<VerticalStackLayout VerticalOptions="Start"> <charts:CartesianChart x:Name="Chart1" ZoomMode="ZoomX" HeightRequest="280"/> <charts:CartesianChart x:Name="Chart2" IsVisible="false" ZoomMode="PanX" HeightRequest="280"/> </VerticalStackLayout> -
We need to provide this Chart with a list of
Seriesentries as well as the customXAxesand theYAxesand a graphTitle. This can be achieved in the code behind of the page. However, it is better to keep the code clean by creating a class to get these attributes. -
In the
DataReposfolder, create a new static class calledChartsRepoto be used for that effect.
Modifying the FitnessRepo (0.5 pt)
- In the
FitnessRepo, new propertiesWeightHistoryand aGoalhave been created to be used to create a weight chart showing a trend. - In addition, you will add calculated properties to be used in the
MeasurePage - Finally, to insure that the UI is notified when the
FitnessRepois changed and we need to insure that the calculated properties are updated when the Meals or Workouts collections are changed.
-
Add the following private method
AddTestData()to help create test data for weights and call the method in the constructor:private void AddTestData(int sample_points = 40) { WeightHistory = new List<Weight>(); Weight weight; DateTime day; //First value is set to obesity level. WeightHistory.Add( new Weight( Weight.ObesityLimit, DateTime.Now.AddDays(-sample_points) )); Random random = new Random(); for (int i = 1; i < sample_points; i++) { var delta = random.NextDouble() - 0.75; var value = WeightHistory[i-1].Value + delta; day = DateTime.Now.AddDays(i - sample_points); weight = new Weight(value, day, Weight.WeightUnit.Kg); WeightHistory.Add(weight); } // setting the current weight and the goal CurrentWeight = WeightHistory[sample_points - 1]; WeightGoal = new Weight(Weight.HealthyMax, DateTime.Now.AddDays(40)); } -
Add two more public properties which we will use in the
MeasurePage:CaloriesBurnt: From theWorkoutitems, calculates the sum of calories of all workouts of the day (Hint: useDateTime.Todayto filter the workouts of interest)CaloriesIngested: From theMealitems, calculate the sum of calories of all meals of the day.
-
Modify the
FitnessReposo that it implements theINotifyPropertyChangedinterface -
Add a private method
OnPropertyChanged()to help raise thePropertyChangedevent:private void OnPropertyChanged(string propertyName) { PropertyChanged?.Invoke(this, new PropertyChangedEventArgs(propertyName)); } -
In the constructor, subscribe to the
CollectionChangedevent of theMealsDb.Itemsand raise the event that theCaloriesIngested:MealsDb.Items.CollectionChanged += (sender, e) => { //... raise the PropertyChanged event for the collection } -
Subscribe to the
CollectionChangedevent of theWorkoutDb.Itemsand raise thePropertyChangedevent on theCaloriesBurntproperty : -
In the
MeasurePage.xaml.csensure to set theBindingContextof the page to theApp.Repowhich is now an observable object. -
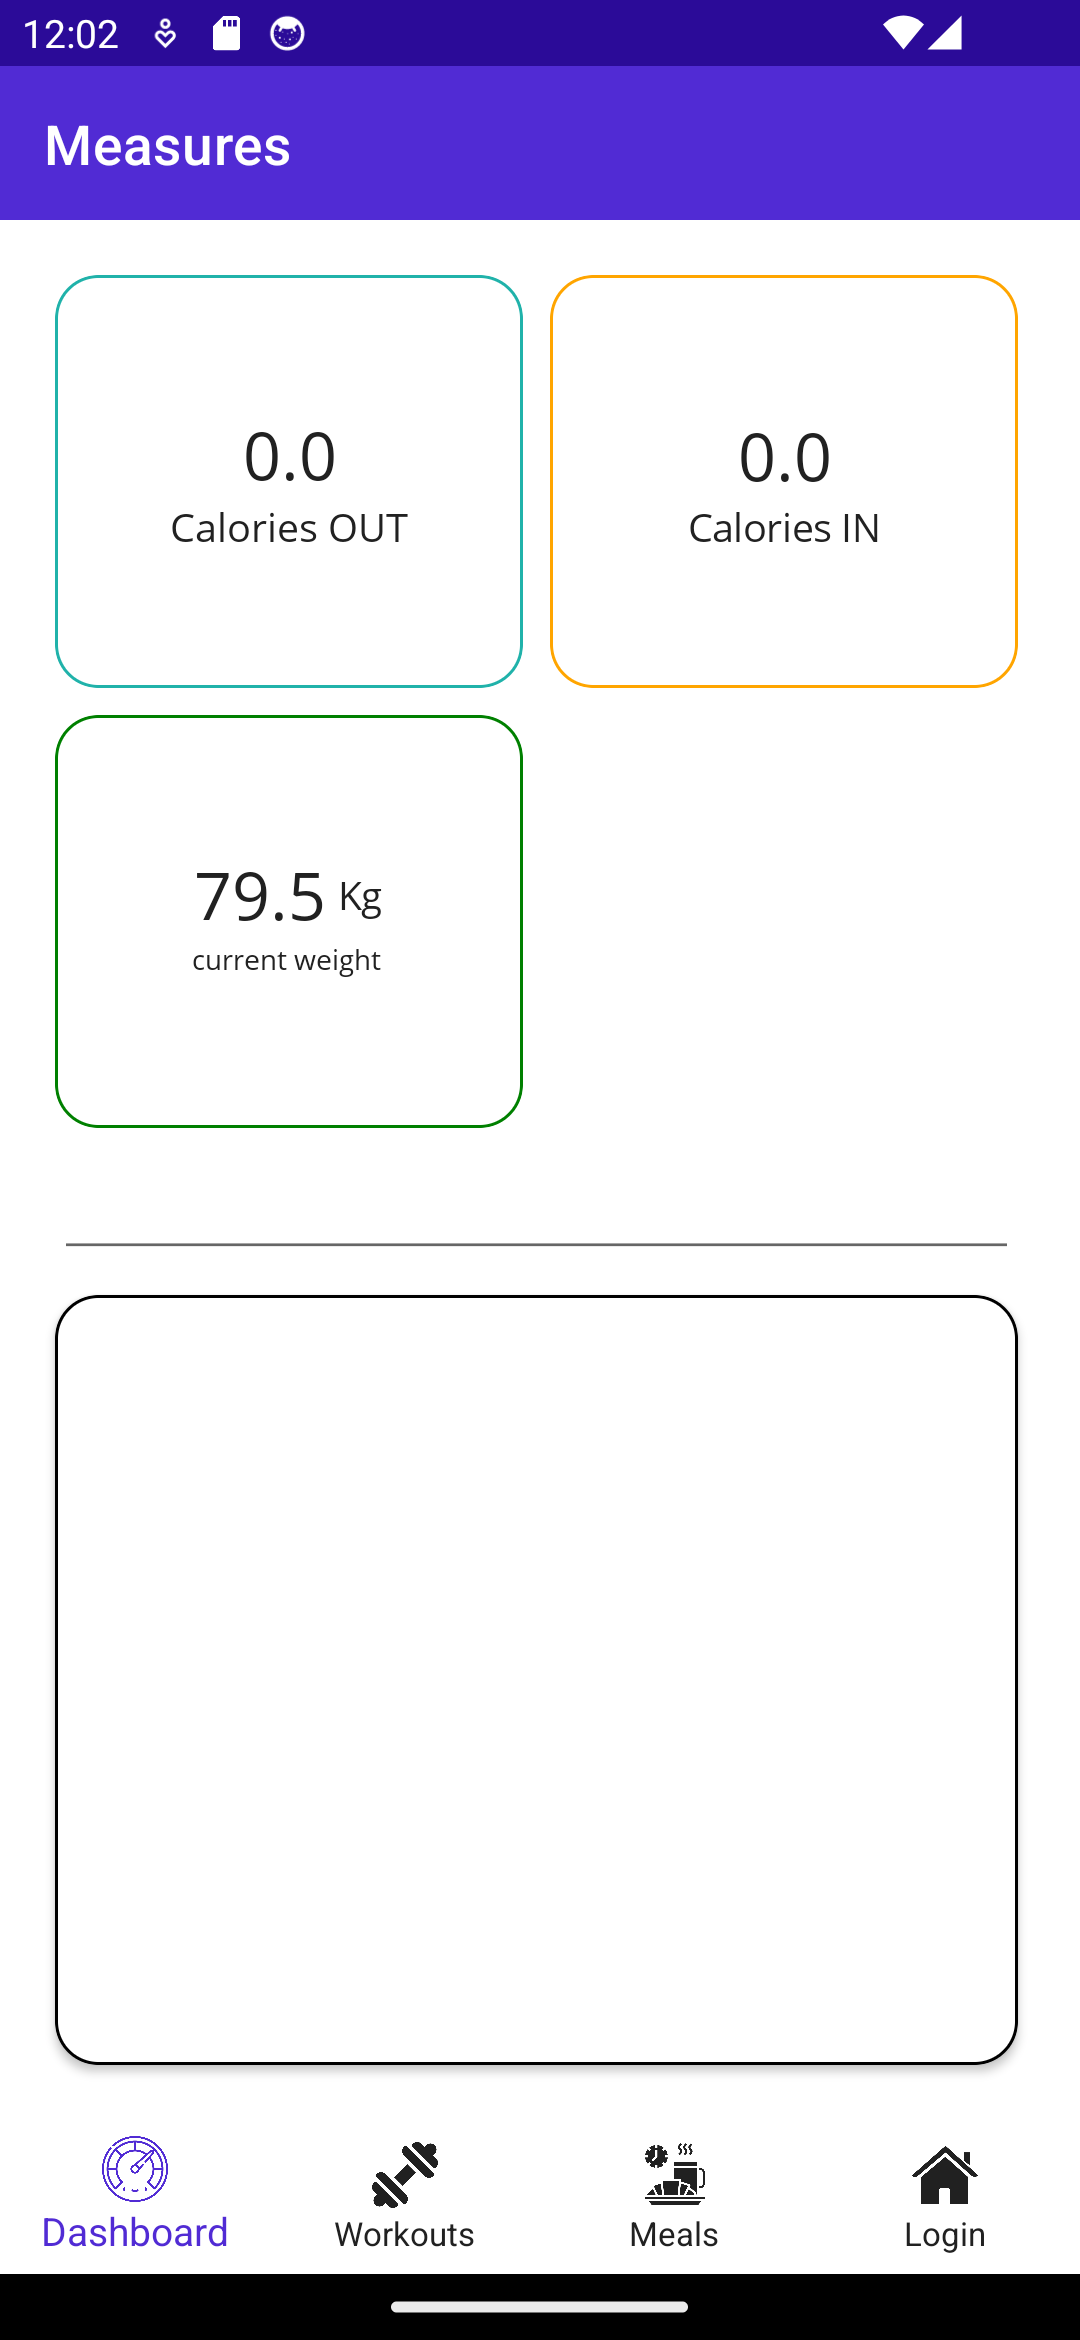
Use data binding to set the calories IN and calories OUT Labels.
-
Use data binding to set the Weight and the weight measurement unit as show below:
-
Add some
Workoutitems andMealitems with today’s date and ensure that the calories count is updated.
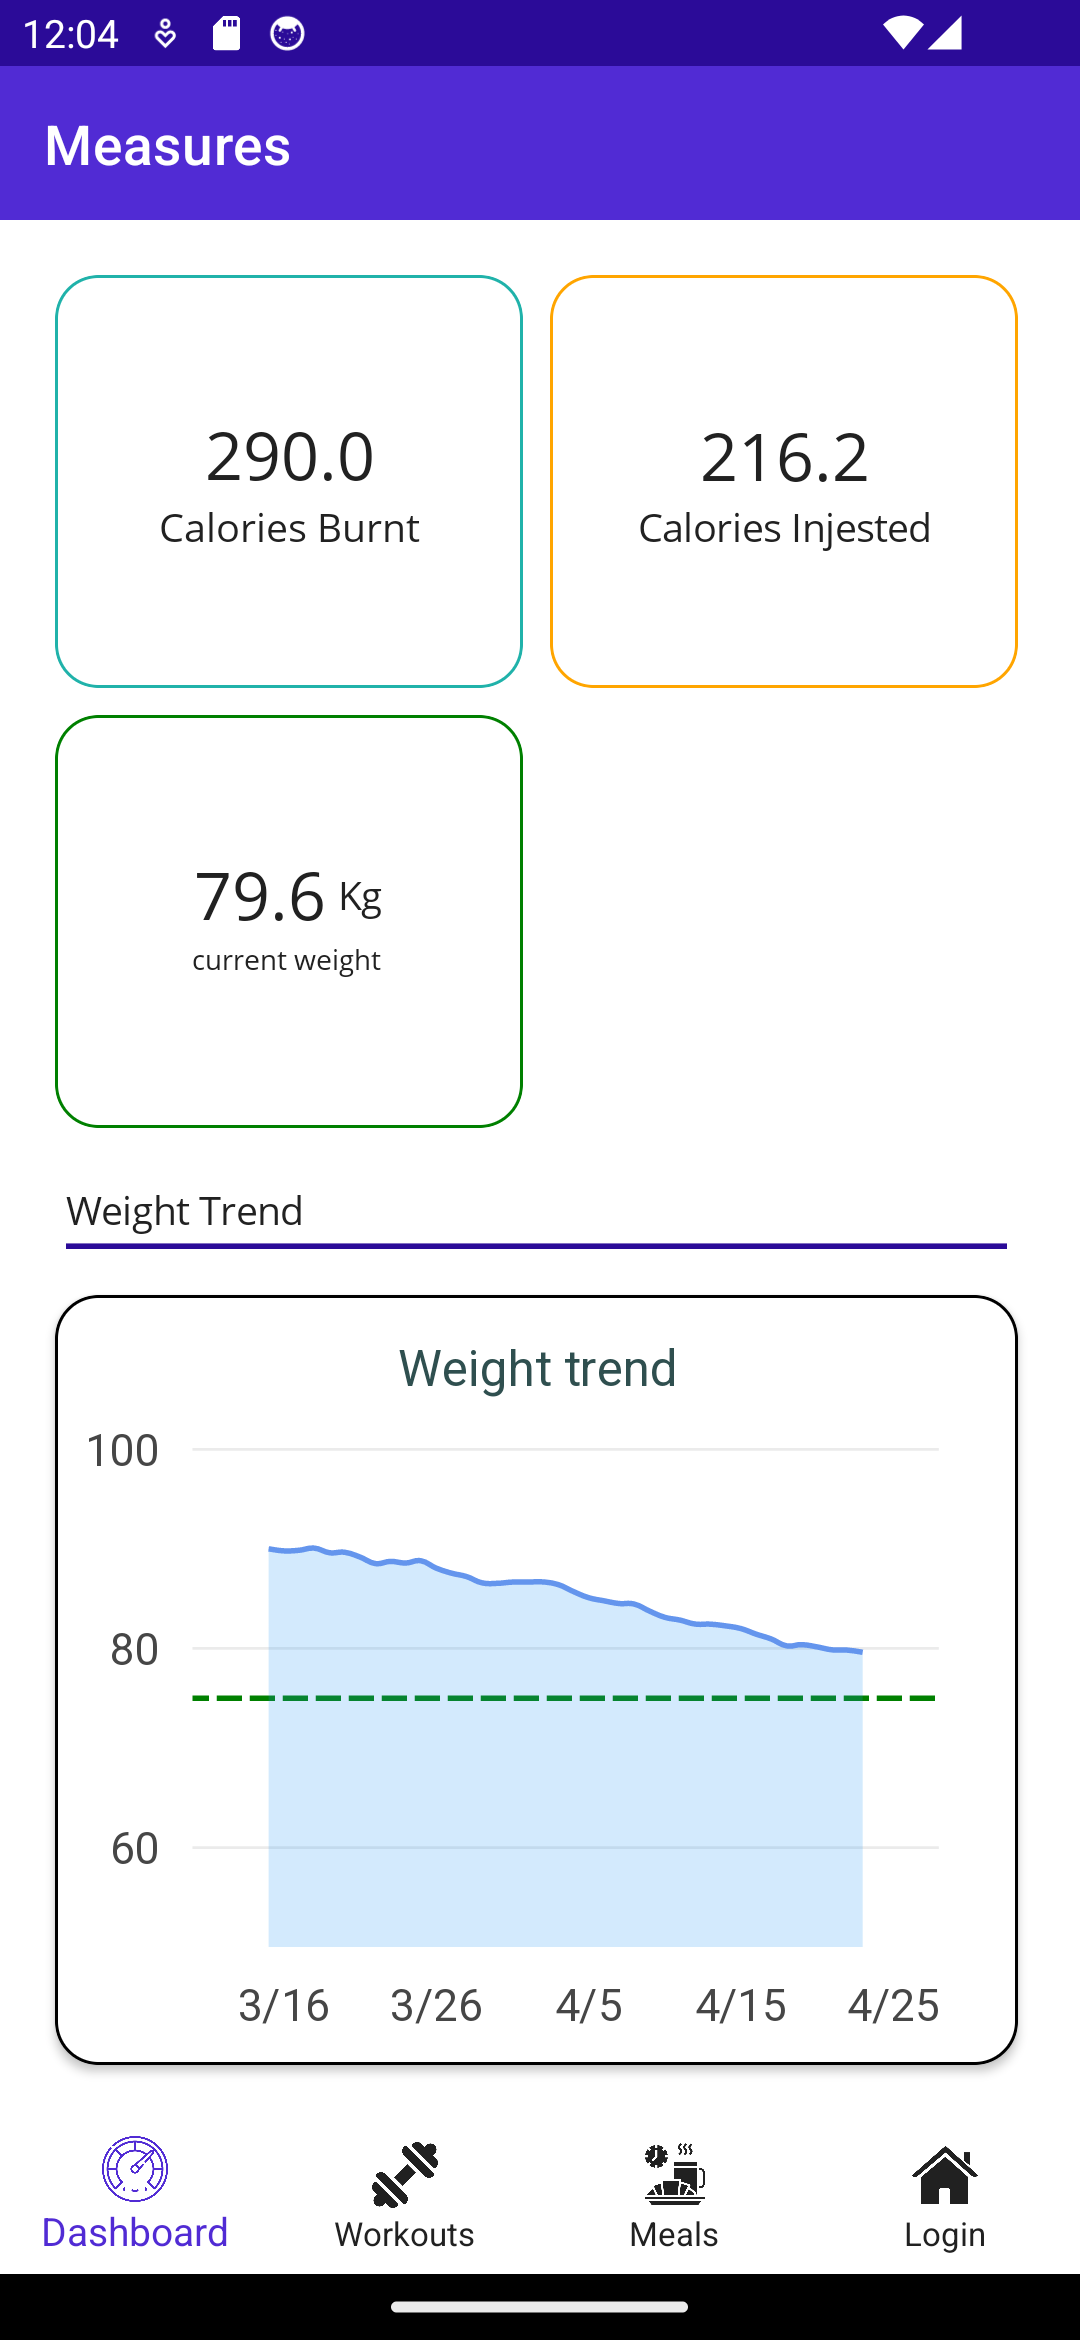
Weight Chart (0.75 pt)
- The data
Seriespopulating thisChartwill be composed ofDateTimePoints DateTimePointis a data point containing aTimeattribute and aValue, this will make it easier for ourselves to display time in the x Axis of the graph.- To build the graph, we will start by firstly creating the attributes that require more logic separately.
- Then we will instantiate one
CartersianChartobject and assign it all the created attributes. - Then, we can use this returned object in the code behind and bind it to the chart item.
-
In the
ChartRepo, create a public methodGetWeightChart()which takes as input:List<Weight> weightsWeight goal
-
Start by converting the
weightscollection intoDateTimePoints -
Create a
LineSeries<DateTimePoint>[]containing oneLineSeries<DateTimePoint>LineSeries<DateTimePoint>[] series = { new LineSeries<DateTimePoint> { Name = "Weight", Value = //.. add conversion here- Set the following attributes:
Stroke: Sets the colors of the line chart, takes asSolidColorPaintas inputGeometrySize: Controls the size of the markers, should be set to 0 as we do not want to have markersGeometryStroke: Controls the border of the markers, set it tonull- LineSmoothness`: controls the line curvature, set it to 0.95
- Set the following attributes:
-
Create a
Axis[]for the y axis containing aAxisobject- Set the following properties:
MinLimit: 40MaxLimit: 100
- Set the following properties:
-
Create a
Axis[]for the x axis containing aDateTimeAxisobject,-
provide the following parameters to the constructor:
-
unit: controls the unit of the axis (hours, days, months), set it toTimeSpan.FromDays(1) -
formatter: a label formatter which transforms the date to a labeldate => $"{....}" // to be completed
-
-
Format the date elements so that the values appear as MM-dd
-
-
Let’s create a
LabelVisualobject to use as a Title for the chart.
-
Set the following properties:
-
Text: “Weight Trend” -
TextSize: 18 -
Padding:new LiveChartsCore.Drawing.Padding(15) -
Paint:new SolidColorPaint(SKColors.DarkSlateGray)
-
- Add a
Sectionwhich is a visual element added to the graph to highlight a particular part. Let’s add a green dashed line to show where the weight goal is:
RectangularSection[] sections =
{
    new RectangularSection
    {
        Yi = goal.Value,
        Yj = goal.Value,
        Label = "TargetWeight",
        Stroke = new SolidColorPaint
        {
            Color = SKColors.Green,
            StrokeThickness = 2,
            PathEffect = new DashEffect(new float[] { 6, 6 })
        }
    }
};
-
Create a new
CartesianChartobject and set its properties:-
Series: to theLineSeries<DateTimePoint>[]created earlier -
YAxes: to theAxis[]created earlier -
XAxes: to theAxis[]created earlier -
Section: to theSectioncreated earlier -
Title: to theLabelVisualcreated earlier.
-
Testing
-
Modify the
MeasurePage.xaml.cscode behind to call theGetWeightChart()use theApp.Repo.WeightHistoryandApp.Repo.WeightGoal -
Set the returned chart to the
Chart1.BindingContextwithin the constructor of the page:Chart1.BindingContext = ChartsRepo.GetWeightChart(App.Repo.WeightHistory, App.Repo.WeightGoal); -
Modify the
MeasurePage.xamlto bind all the attributes of the chart:Correction 04-26-2024: If you cannot see the chart, this could be related to the height of the chart being automatically set to 0. Make sure to set the
HeightRequest
<charts:CartesianChart x:Name="Chart1"
                       Series="{Binding Series}"
                       XAxes="{Binding XAxes}"
                       YAxes="{Binding YAxes}"
                       Title="{Binding Title}"
                       Sections="{Binding Sections}"
                       HeightRequest="280"
                       ZoomMode="ZoomX"/>
Calories Chart (0.75 pt)
- The idea behind this chart is to be able to visually compare the calories intake to the calories burnt on a daily basis and see the progress overtime.
- The information will be conveyed in a bar chart and to make a distinction between calories burnt and calories ingested we will use two different colors orange and blue. Feel free to select other colors.
-
Create a public method
GetCaloriesChart()which takes a input:-
ObservableCollection<Meal> meals -
ObservableCollection<Workout> workout -
returns a
CartesianChart
-
-
First, start by converting the Meals collection into an array of
DateTimePoints where each point represents the total calories ingested during a day.
Hint: Use
GroupBy()to group Meals by day, then use aSelect()on each group and return aDateTimePointwith the associated day and caloriesSum().
-
Repeat the same process for the Workouts collection but use the negative sum of the calories per day.
-
Create a
ISeries[]list containing twoColumnSeries<DateTimePoint>():ISeries[] series = { new ColumnSeries<DateTimePoint>() { Name="Calories IN", Values = caloriesInPerDay, //..to be completed... }, new ColumnSeries<DateTimePoint>() { Name="Calories OUT", Values = caloriesOutPerDay, } }For each
ColumnSeriesset the:Stroke: takes aSolidColorPaintFill: takes aSolidColorPaintMaxBarWidth: 10- Set the meals series color to
SKColors.Orange - Set the workouts series color to
SKColors.CornflowerBlueand the meals color toSKColors.Orange
-
Create a
Axis[]for the y axis containing oneAxisobject -
Set the following properties:
-
MinLimit: - 800 -
MaxLimit: +800 -
MinStep: 500 -
ForceStepToMin: true
-
-
Create a
Axis[]for the x axis containing oneDateTimeAxisobject, provide the following values to its constructor-
unit:TimeSpan.FromDays(1) -
formatter:date => $"{....}" // to be completed
Format the date elements so that the values appear as “Friday 04-26”
-
-
Create a
LabelVisualobject to use as a Title for the chart. Set the following properties:Text: “Calories Trend”TextSize: 18Padding:new LiveChartsCore.Drawing.Padding(15)Paint:new SolidColorPaint(SKColors.DarkSlateGray)
-
Create and return a new
CartesianChartwhile setting its properties:Series: to theISeries[]created earlierYAxes: to theAxis[]created earlierXAxes: to theAxis[]created earlierTitle: to theLabelVisualcreated earlier.
Testing
-
Make sure to add enough valid
MealsandWorkoutto your database. -
Modify the
MeasurePage.xaml.cscode behind to call theGetCaloriesChart() -
Set the returned chart to the
Chart1.BindingContextwithin the constructor of the page:Chart2.BindingContext = ChartsRepo.GetCaloriesChart(App.Repo.MealsDb.Items, App.Repo.WorkOutDB.Items); -
Modify the
MeasurePage.xamlto bind all the attributes of the chart:<charts:CartesianChart x:Name="Chart2" Series="{Binding Series}" XAxes="{Binding XAxes}" YAxes="{Binding YAxes}" Title="{Binding Title}" IsVisible="false" ZoomMode="PanX" HeightRequest="280"/> -
Add an event handler to the
Pickerin which you should make visible the chart selected by the user.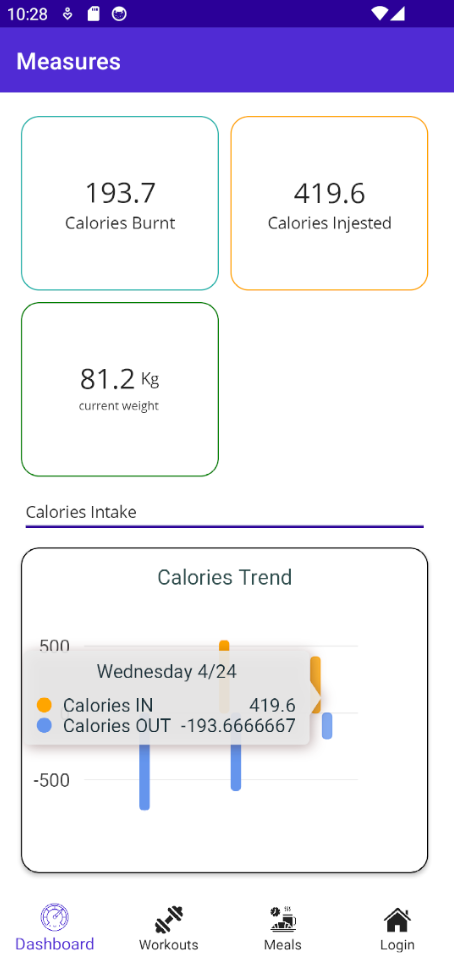
-
You’ll notice that the charts do not update if the data is modified. To ensure that the charts are reevaluated override the
OnAppearingmethod to set the Charts binding context here:protected override void OnAppearing() { Chart1.BindingContext = ChartsRepo.GetWeightChart(App.Repo.WeightHistory, App.Repo.WeightGoal); Chart2.BindingContext = ChartsRepo.GetCaloriesChart(App.Repo.MealsDb.Items, App.Repo.WorkOutDB.Items); Chart1.IsVisible = true; Chart2.IsVisible = false; }✨ Test your understanding: How can you ensure that the charts are updated in real time as you are receiving real time data?